Choropleth maps portray quantitative data as a color showing the density, percent, average value, or quantity of a phenomenon within the boundary of a geographic area. In a standardized choropleth map the data are standardized so that it may allow the comparison of the distribution among different areas. This particular map deals with the population density of Costa Rica. The distributions are able to be compared to each other.
Tuesday, July 22, 2008
Monday, July 21, 2008
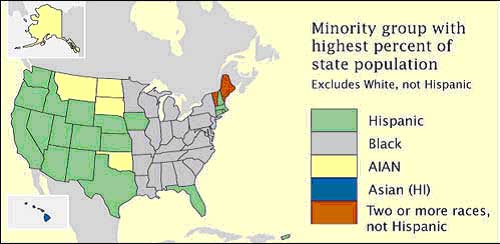
Nominal area choropleth map

Choropleth maps portray quantitative data as a color showing the density, percent, average value, or quantity of a phenomenon within the boundary of a geographic area. In a nominal choropleth map the data that is displayed is nominal data. This particular map is a nominal area choropleth map as it displays nominal data and it is also a unstandardized choropleth map. It shows the minority groups with the highest percentage of state population in certain states of the U.S.
Unstandardized choropleth maps
Choropleth maps portray quantitative data as a color showing the density, percent, average value, or quantity of a phenomenon within the boundary of a geographic area. In an unstandardized choropleth maps only the raw numbers are utilized therefore they are the only ones displayed. Because of this the map data that is displayed is not an average but only the raw data. The variables themselves don’t vary as there is no specific ranking assigned to the any of the variables, in other words, neither of the categories is higher or lower than the other. This particular map portrays all of the states of the United States. Neither of them are attributed a higher value then any of the others but they are all portrayed in a different color, this is a great example of an unstandardized choropleth map.
Univariate choropleth maps
Saturday, July 19, 2008
Bivariate choropleth maps/ Cartographic animation
Choropleth maps portray quantitative data as a color showing the density, percent, average value, or quantity of a phenomenon within the boundary of a geographic area. Bivariate choropleth maps display two different variables both of which are displayed on one map by including two different sets of graphic symbols or colors. In this particular map you see the increase from the divorce rate in 1980 to the divorce rate in 1990. This map is also an example of cartographic animation.
Unclassed choropleth maps
Choropleth maps portray quantitative data as a color showing the density, percent, average value, or quantity of a phenomenon within the boundary of a geographic area. The unclassed choropleth map assigns shadings proportional to the data values so that these choropleth maps do not have to classify the data. The map shown is an example of an unclassed choropleth map.
Classed choropleth maps
Choropleth maps portray quantitative data as a color showing the density, percent, average value, or quantity of a phenomenon within the boundary of a geographic area. In a classed choropleth map the main objective is to determine height and shading or color intensity of the bar for each map that is to be classed. This particular map is used to show the quality of life of Brazilians within the country.
Thursday, July 17, 2008
Black and White Aerial Photo
Wednesday, July 9, 2008
Doppler radar
A Doppler radar is a radar using the Doppler effect of the returned echoes from targets to measure their radial velocity.Doppler radars are used in air defense, air traffic control, sounding satellites, police speed guns, and radiology. This particular picture is of a Doppler radar that has been used for weather purposes. It is a picture of Hurricane Isabelle as it is striking the coast.
Subscribe to:
Comments (Atom)